Power-duration model · CP & W′
You can push. But for how long?
Critical Power and W′ describe, with just two numbers, how hard you can go and for how long. Here is the essential theory, the test protocols, and a calculator that estimates CP, W′ and your zones.
- 2 parameters
- CP and W′ describe the whole curve
- 3 → 30 min
- the window where the model holds
- 4 tests
- maximal efforts for a sturdy estimate
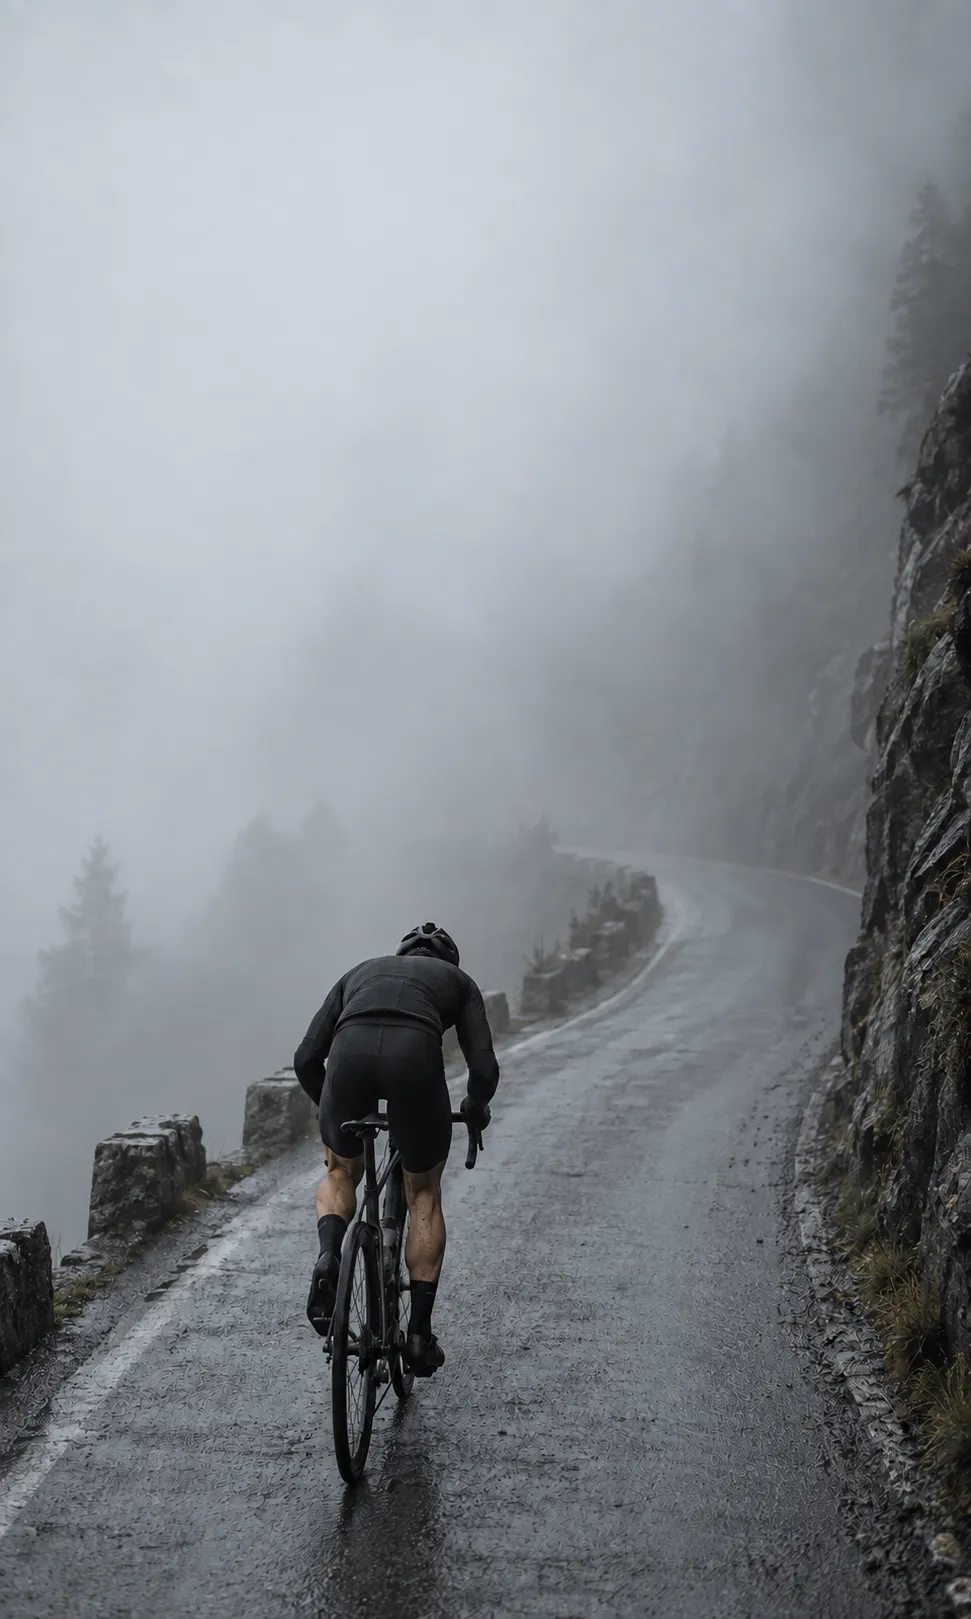
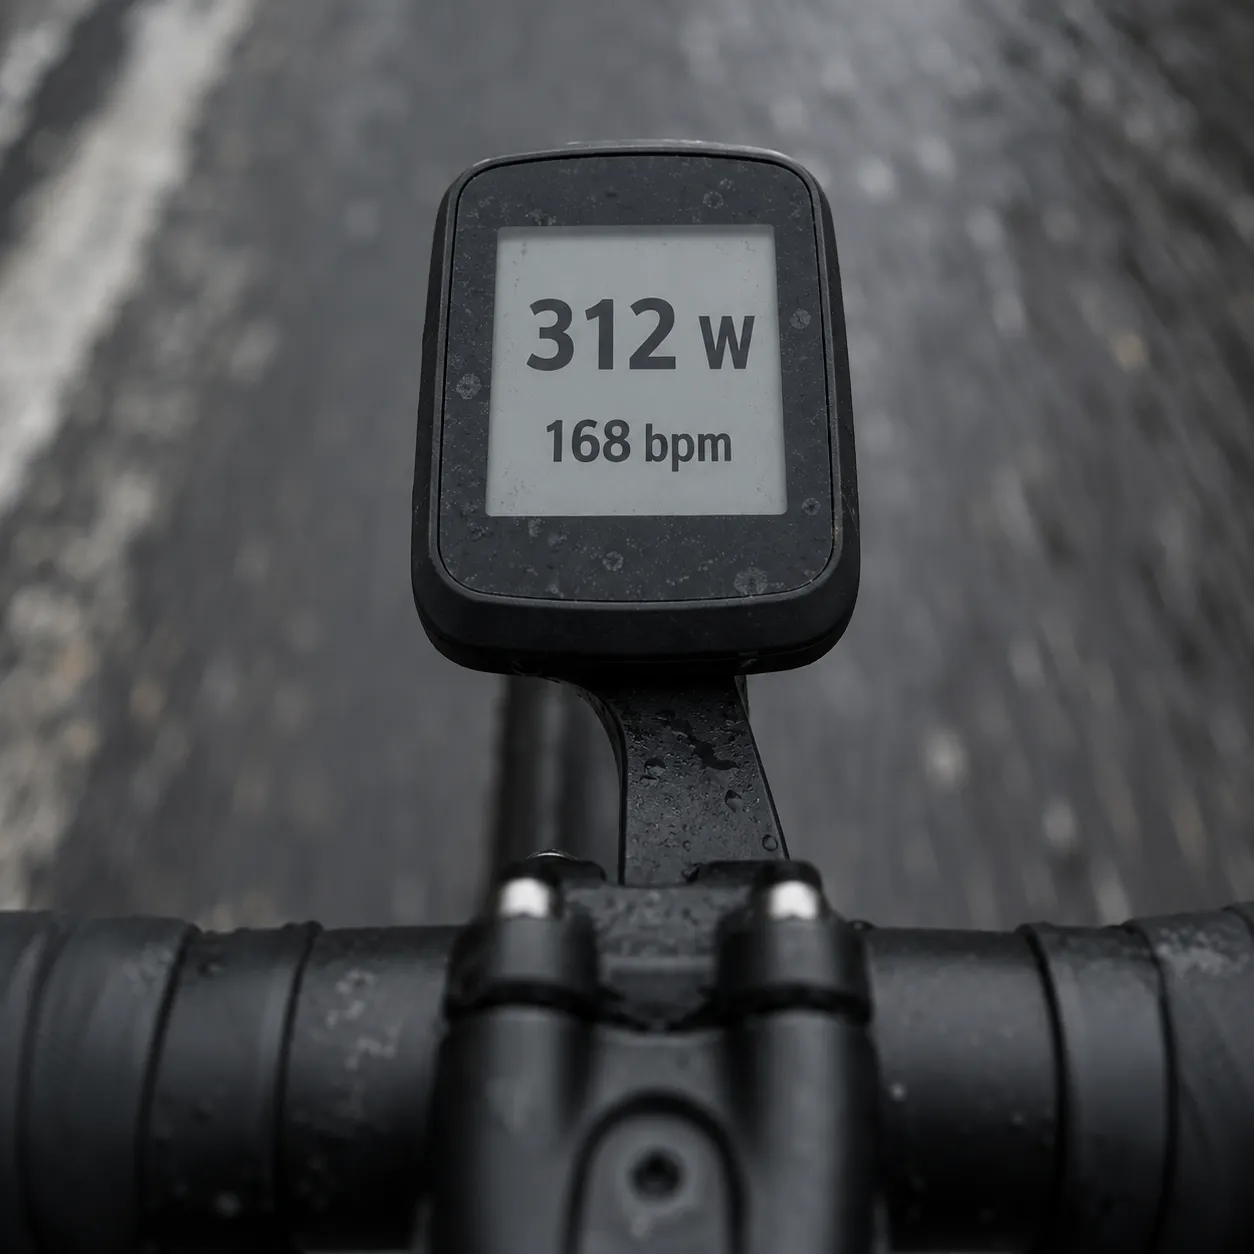
W′your tank above threshold
What Critical Power is
Above a certain power, the relationship between power and time to exhaustion follows a well-defined hyperbolic curve. That curve is described by just two parameters: critical power (CP) and W′.
CP is the power you tend towards as effort duration increases indefinitely: in practice it is the boundary between the heavy and severe domains, and sits around the maximal lactate steady state. In the real world CP can be held for roughly 30 minutes.
W′ (“W prime”) is the amount of work, in kilojoules, you can produce above CP before stopping. It is a finite tank: you spend it above CP and refill it below.
CP · WATTS
The asymptotic power
Sustainable for a long time, driven by the aerobic system. Above it, the clock is running.
W′ · KILOJOULES
The anaerobic tank
Finite energy available above CP. It also tells you how close CP sits to your aerobic capacity.
3 → 30 MIN
The valid window
The model is reliable between 3 and 30 minutes. Outside that range predictions degrade fast.
W′, your tank above threshold
W′ depends on several physiological variables but is broadly read as anaerobic capacity. An alternative reading: it indicates how close your CP is to your aerobic capacity. Riders with a low CP relative to V̇O2max (low fractional utilisation) tend to have a larger W′.
There is no “right” W′: it depends on the discipline. A time triallist needs a high CP; a crit racer needs a bigger tank.
W′ reference values (kJ)
| Profile | Men | Women |
|---|---|---|
| Endurance, moderately trained | 9 – 15 | 6 – 10 |
| Punchy disciplines (crits, rolling races) | 15 – 18 | 11 – 13 |
| Sprinters / track | 25 – 30+ | 18 – 25+ |
Indicative values for moderately trained athletes; they can be higher in well-trained riders with a high V̇O2max (Vanhatalo et al., 2011).
CP & W′ calculator
Enter 2 to 4 maximal efforts lasting between 3 and 20 minutes. The calculator runs a linear regression of P against 1/t: the slope is W′, the intercept is CP.
Your tests
01
02
03
Only used for per-kilogram values. Leave it empty if you prefer.
Your data stays saved locally in this browser.
Critical Power
275 W
3.93 W/kg
W′
15.6 kJ
222 J/kg
Fit quality
R² = 0.993
Excellent fit
Your tests describe a clean line: the estimate is trustworthy.
Estimated FTP for zones
259 W≈ 94% of CP
Power-duration curve
The curve shows predicted maximal power for each duration. The dashed line is CP: the asymptote the curve falls towards.
Predicted maximal power
| 3 min | 361 W | 5.16 W/kg |
|---|---|---|
| 5 min | 327 W | 4.67 W/kg |
| 8 min | 307 W | 4.39 W/kg |
| 12 min | 297 W | 4.24 W/kg |
| 20 min | 288 W | 4.11 W/kg |
| 30 min | 284 W | 4.05 W/kg |
Training zones
calculated on estimated FTP, not on CP
- Z1Active recovery< 142 W
- Z2Endurance145 – 194 W
- Z3Tempo197 – 233 W
- Z4Threshold235 – 271 W
- Z5V̇O2max274 – 310 W
- Z6Anaerobic capacity313 – 388 W
- Z7Neuromuscular> 390 W
How to run the tests
Two tests are enough in theory, but 3-4 efforts give a sturdier estimate and let you measure its reliability. Recommended durations: 3, 5 and 12 minutes, plus an optional 20-minute test.

Pick the durations
3, 5 and 12 minutes, plus an optional 20-minute test. Any duration between 3 and 20 minutes works, but at least one test over 10 minutes improves accuracy.
One test per day
Different tests on different days, well recovered. Two tests in one day under-estimate W′, because the tank has not refilled.
Choose a method
Self-paced time trial (fixed duration) or time to exhaustion at fixed power. Keep the same method: switching can shift CP by 7% and W′ by 12%.
Even pacing
Keep power as steady as you can: don’t start hard and fade. Bad pacing is the number one cause of nonsense estimates.
Feed the model
Enter duration and average power for each test in the calculator: you get CP, W′ and the R² that tells you how much to trust it.
Repeat every 6-8 weeks
Same durations, same method, same environment (indoor or outdoor). Only then are comparisons over time meaningful.
Warm-up template (Jones et al., 2003)
- 10-15′
- Gradual ramp from 2/10 to 4/10 effort (about 45% → 75% of FTP/CP).
- 2-3 × 1′
- Short efforts above expected CP: you should feel lactate building, without going all-out.
- 4-5′
- Easy spinning at 2-3/10 (45-55% FTP) to let lactate come back down before the test.
Golden rules
- Warm up properly: the model assumes the aerobic system kicks in instantly, and a good warm-up shrinks that lag.
- It takes at least three testing sessions before results become reliable: treat the first two with caution.
- Indoor and outdoor are not comparable: pick one context and stick to it.
- If the numbers say you have a huge W′ but you know sprinting is your weakness, the data is wrong, not you.
CP, FTP, MLSS, lactate threshold
Close relatives, not interchangeable. They measure different things and are obtained in different ways.
| Metric | What it measures | How you get it |
|---|---|---|
| CP | Boundary between heavy and severe domains; maximal theoretically sustainable power, with W′ attached. | 3-4 maximal efforts between 3 and 20 minutes, regression of P on 1/t. |
| FTP | Practical estimate of the power sustainable for about an hour; approximates lactate threshold. | 95% of 20-minute test power, or a ramp test. |
| MLSS | Highest intensity at which blood lactate stays in steady state. CP sits very close to it. | Series of 30-minute rides at different intensities with lactate sampling. |
| Lactate threshold | Intensity at which lactate starts rising above baseline. Tends to be lower than CP. | Incremental lab test with capillary blood samples. |
Common mistakes and model limits
Using CP as FTP
CP comes out higher than FTP: copying it into your zones means chronically training too hard. Apply the ~94% factor.
Only two tests
With two points the line always fits perfectly: zero information about reliability. With 3-4 points the R² actually means something.
Mixing methods
Time to exhaustion and fixed-duration trials give different results (CP -7%, W′ +12%). Don’t compare apples and pears.
Tests too long or too short
Under 3 minutes the anaerobic contribution dominates, over 20 the model frays. Stay inside the window.
Testing tired or stressed
Fatigue, motivation, heat, sleep: it all lands in the number. Always read results in the light of the day you had.
Taking predictions literally
Between 3 and 30 minutes they are a useful guide, not a guarantee. A 10-minute effort is predicted better than a 3-minute or a 20-minute one.
W′ balance: using it while racing
If W′ is a tank, W′ balance is the fuel gauge: it drains when you ride above CP, in proportion to how far above you are, and refills below CP, faster the easier you ride.
Many head units display it live. The point is not to empty the tank before the moment that decides the race: the last kick, the sprint, the final climb.
- ABOVE CP
- The tank drains faster the further above CP you ride.
- BELOW CP
- It refills exponentially: the easier you ride, the quicker you recover it.
- RACING
- Keep a reserve for the decisive move; at zero, your power collapses towards CP.
FAQ
How often should I retest?
Every 6-8 weeks, or at every change of training block. Always use the same durations and method, otherwise you are comparing different measurements.
Can I get CP and W′ from Strava or TrainingPeaks history?
Partly. Recorded power peaks can act as model points, but only if they were genuinely maximal, well paced, and close together in time. Dedicated tests remain far more reliable.
Can CP and W′ be trained separately?
Yes, and that is part of why the model is useful. Work around CP (threshold, sweet spot) and V̇O2max intervals raise CP; short repeated anaerobic efforts develop W′. Pushing one hard can compress the other.
Should I test indoors or outdoors?
Both are fine, but don’t mix them. Indoor is more repeatable (no wind, no traffic), outdoor is more race-specific. Choose and stay consistent.
What does a low R² mean?
That your points don’t sit on a line: almost always a pacing problem or insufficient recovery between tests. Find the point furthest from the line and repeat that effort.
Is CP my maximal lactate steady state?
It sits very close (Poole et al., 2016) but tends to come out slightly above lactate threshold and FTP. Treat it as an excellent approximation, not a lab measurement.
Do I really need a power meter?
Yes. The model is built on real watts; heart rate alone cannot give reliable CP and W′.
Glossary
- CP
- Critical power: the asymptote of the power-duration curve, in watts.
- W′
- Work available above CP, in kilojoules. Pronounced “W prime”.
- W′ balance
- The share of W′ still available at a given moment.
- FTP
- Functional Threshold Power: estimated power sustainable for about an hour.
- MLSS
- Maximal lactate steady state: highest intensity with stable lactate.
- V̇O2max
- Maximal oxygen uptake: the ceiling of the aerobic system.
- Fractional utilisation
- The percentage of V̇O2max you can sustain at threshold.
- TTE
- Time to exhaustion: how long a given power can be held.
- R²
- How well your tests sit on the model’s line (1 = perfect).
- Erg mode
- Trainer mode that holds a fixed power regardless of cadence.
References
- (2020) Relationship between the critical power test and a 20-min functional threshold power test in cyclingFrontiers in Physiology, 11, 613151
- (2018) Critical power: how different protocols and models affect its determinationJournal of Science and Medicine in Sport, 21(7), 742-747
- (2017) Comparison of critical power and W' derived from 2 or 3 maximal testsInternational Journal of Sports Physiology and Performance, 12(6), 825-830
- (2016) Critical power: an important fatigue threshold in exercise physiologyMedicine & Science in Sports & Exercise, 48(11), 2320-2334
- (2011) Application of critical power in sportInternational Journal of Sports Physiology and Performance, 6(1), 128-136
- (2010) Training and racing with a power meterVeloPress, 2a edizione
- (2003) Prior heavy exercise enhances performance during subsequent perimaximal exerciseMedicine & Science in Sports & Exercise, 35(12), 2085-2092
The content on this site is an original synthesis of the literature listed above. The calculator gives estimates: the model describes the power-duration relationship well, but it is not a substitute for physiological testing.
Last updated